Home / Products / EnerGaze
On-Demand EM&VEnerGaze

The On-Demand EM&V Platform

EnerGaze delivers measurement and verification the moment you need it. Built for continuous, embedded evaluation, it runs alongside your programs using advanced statistical models aligned with Uniform Methods Project (UMP) standards — so savings estimates update as new data arrives instead of waiting on an evaluation cycle.

On-Demand EM&VContinuous EvaluationUMP-Aligned
Key Features

Built for rigorous EM&V, on demand and always on

On-Demand EM&V

Savings estimates and verification results produced the moment a question is asked — not weeks or months into an evaluation cycle.

Continuous, Embedded Evaluation

Evaluation runs alongside your programs, embedded in operations, with results that refresh as new billing and interval data arrives.

Advanced Modeling

Multiple statistical models with standardized workflows — including TWFE, Post Regression, Conditional Savings, and Time Period Savings.

Flexible Grouping

State-level, wave-based, and combined grouping capabilities.

Intelligent Treatment

Automatic treatment date inference and validation.

Unified Diagnostics

Consistent workflows across all models, with unified diagnostic records and metrics behind every result.
Statistical Models

Uniform Methods Project models, implemented with standardized workflows

UMP 4.4.8

PostRegression

Enhanced treatment logic with automatic treatment date inference — before-after analysis with control groups.

UMP 4.4.6

TWFE

Two-Way Fixed Effects model with entity and time fixed effects for panel data.

UMP 4.4.7

TimePeriodSavings

Interval-level analysis with panel data methods.

UMP 4.4.5

ConditionalSavings

Regression with weather/occupancy interactions for weather-normalized modeling.

UMP 4.4.3

SimpleDifferences

Basic difference-in-differences estimation.

UMP 4.4.4

HeterogeneousSavings

Models varying treatment effects across different units.
Workflow Automation

End-to-End Evaluation Pipeline

Raw Meter DataPreprocessingDiagnostics
PassModel Selection
FailError Report
PostRegressionTWFETimePeriodSavingsConditionalSavings
Treatment Effect Estimation
HTML ReportCSV Artifacts

Intelligent Data Inference

Maps field aliases to canonical fields, auto-detects cohort indicators, builds a post-period indicator for diagnostics, and preserves original cohort flags.

Prechecks & Cleaning

Validates timestamps and energy values, ensures treated sites have both pre and post observations, removes problematic rows, and logs all actions.

Workflow Orchestration

The workflow runner coordinates preprocessing, model selection, registry, and reporting to emit final artifacts.
Comprehensive Visualizations

Robust analysis outputs with publication-ready graphics

  • Treatment effect comparisons across models
  • Time-series analysis with trend lines
  • Multi-dimensional grouping visualizations
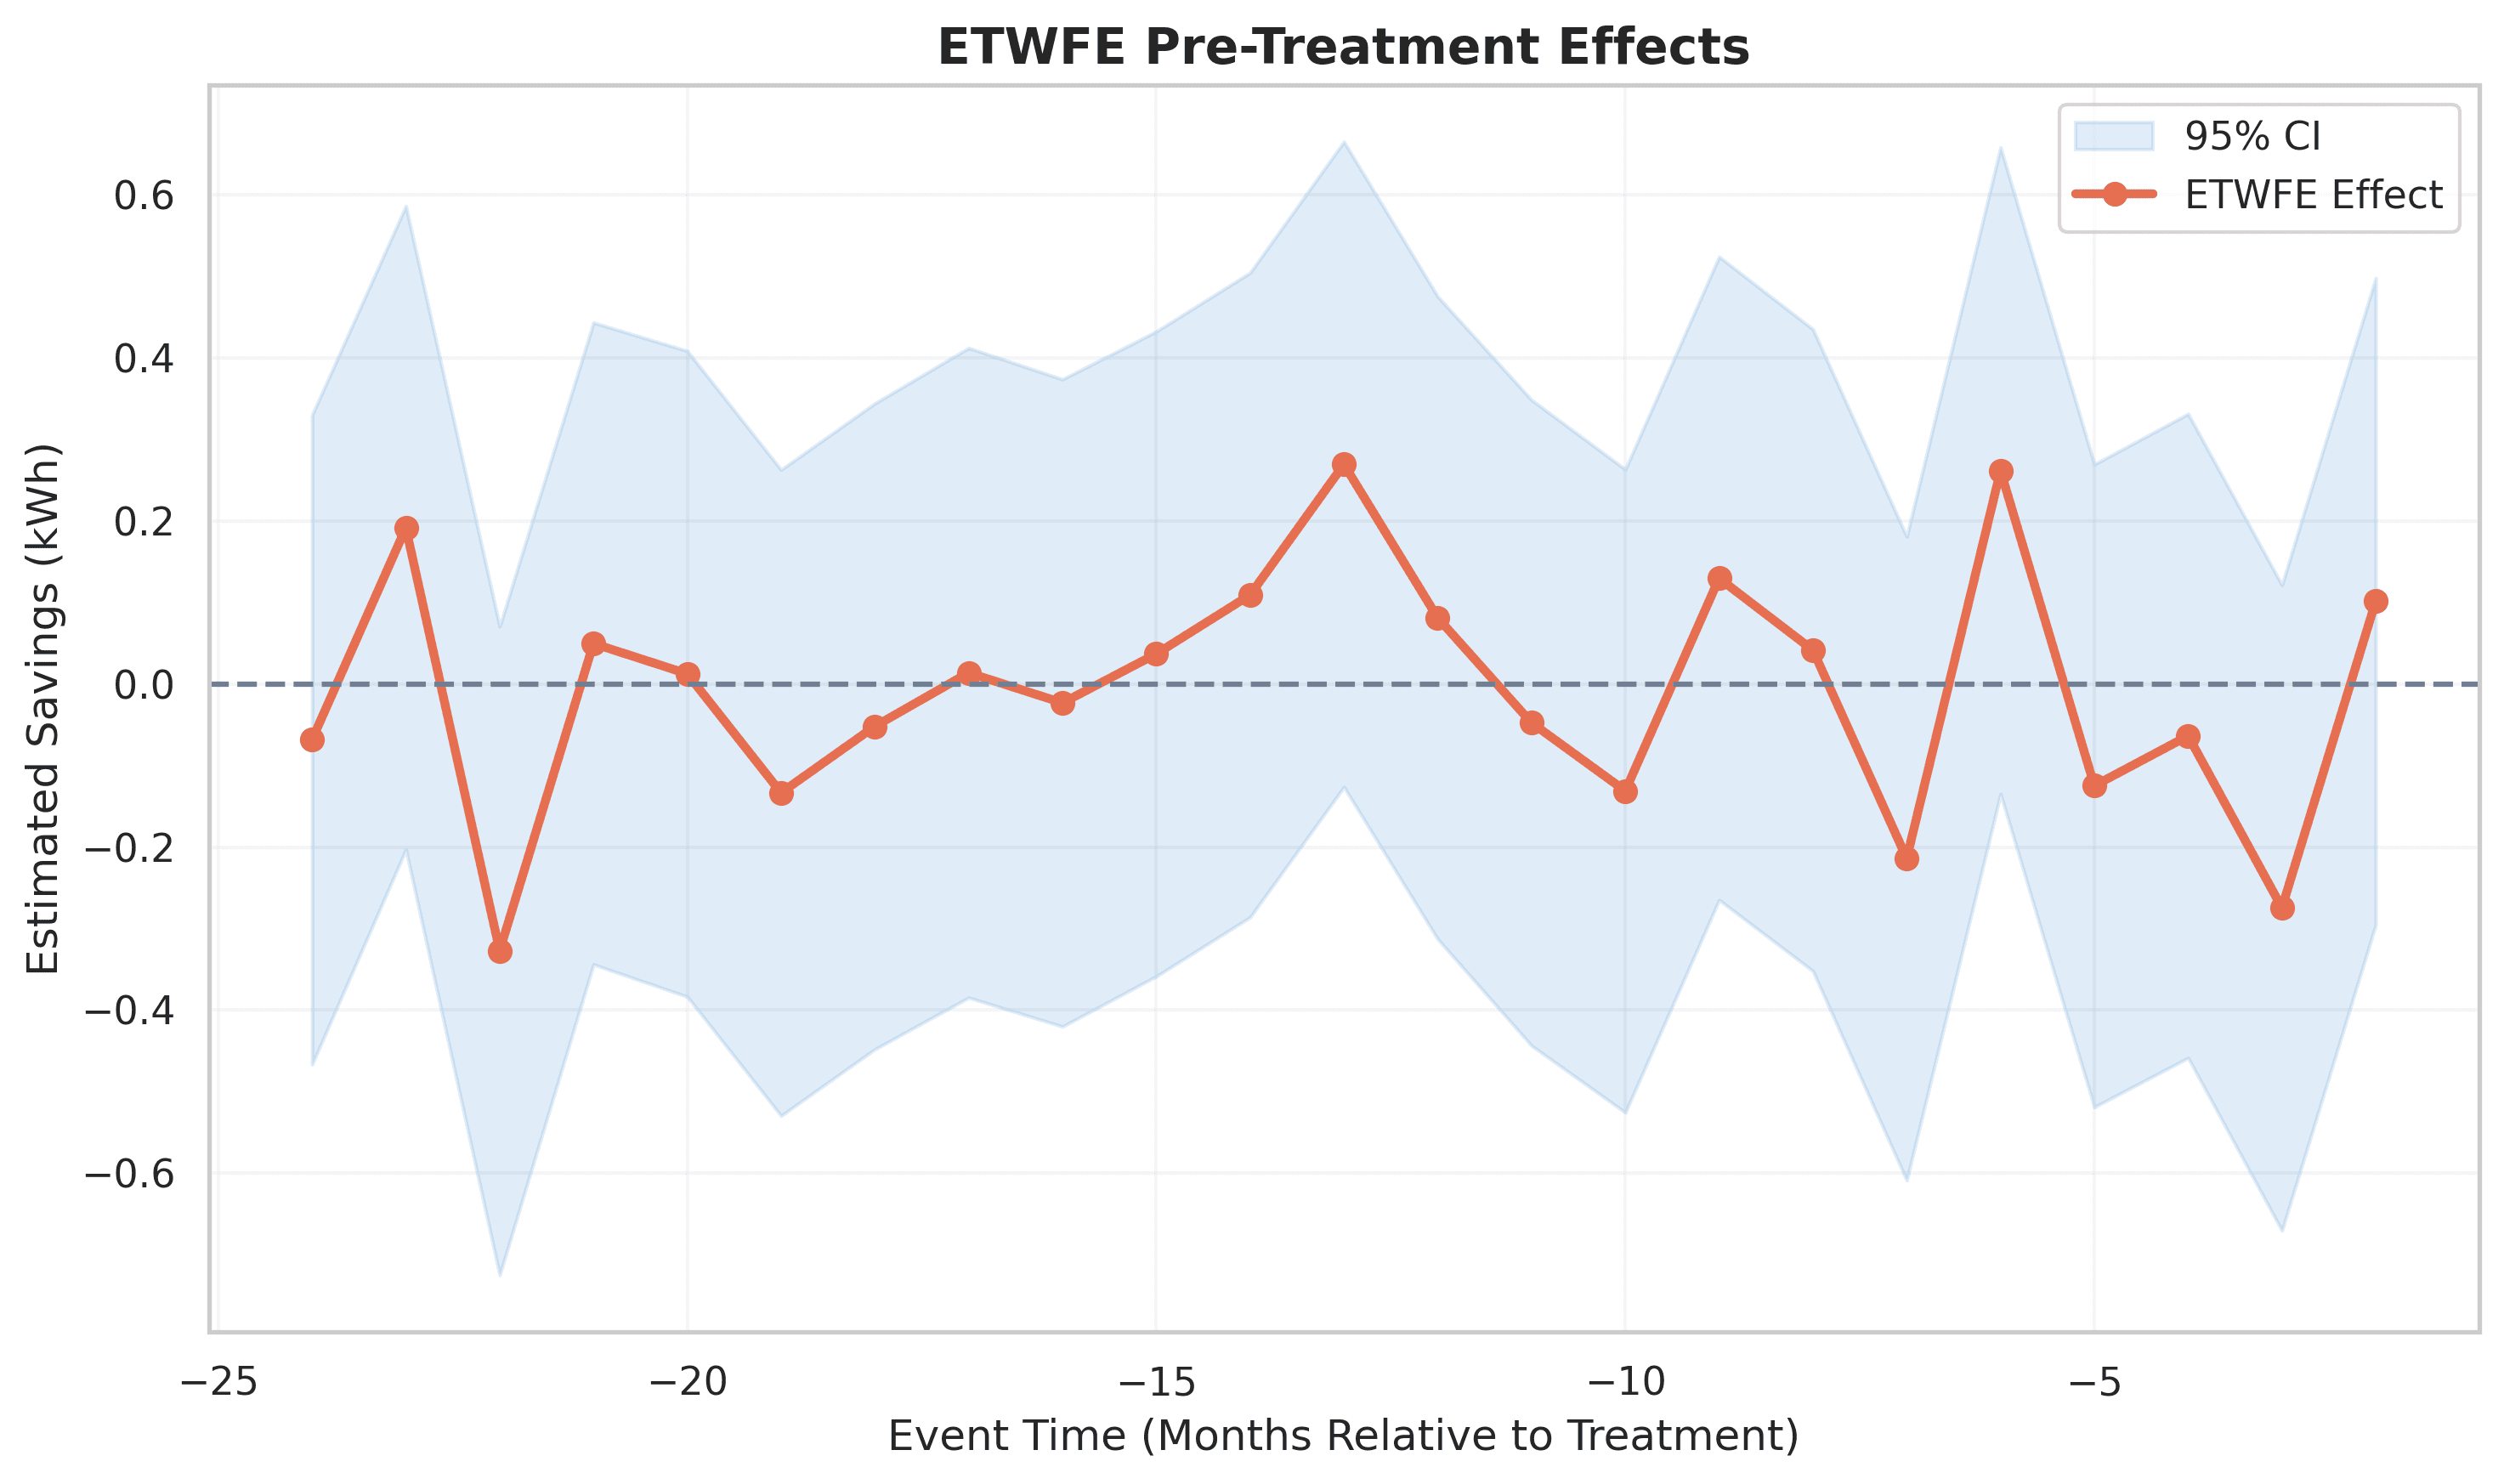
  • Pre/post period consumption patterns with parallel-trend insights
  • State and wave-level comparisons
ETWFE pre-treatment effects chart
Benefit-Cost Analysis

Every standard cost-effectiveness test, built in

Regulators, program managers, and ratepayer advocates each evaluate portfolios from a different perspective. EnerGaze computes the full suite of benefit-cost tests at the measure, program, sector, and portfolio level — by year and across multi-year plan periods — with ratios ready for filings.

UCT

Utility Cost Test

Cost-effectiveness from the utility perspective: program benefits versus the utility's incentive and administrative costs.

TRC

Total Resource Cost

Benefits compared to program costs plus the incremental cost of high-efficiency equipment, regardless of who pays.

SCT

Societal Cost Test

Extends the TRC with societal impacts — avoided environmental externalities and other non-energy benefits when quantified.

PCT

Participant Cost Test

The customer's perspective: bill savings plus incentives compared to the incremental costs participants incur.

RIM

Rate Impact Measure

The non-participant perspective: program benefits versus program costs plus lost utility revenues.

E-RIM

Electric-Only RIM

Verifies that programs adding electric load will not increase electric rates for non-participants.

Every test, every program, every year — with side-by-side benefit-cost ratios at the sector and portfolio level.

Portfolio Planning & Compliance

Savings targets, budgets, and measure life — tracked and filing-ready

Statutory savings mandates come with detailed accounting rules. EnerGaze tracks portfolio performance against them continuously, so compliance is a report away rather than a year-end scramble.

Savings-Target Tracking

Annual savings measured as a percent of prior-year sales, with allowable load-forecast deductions and exemptions applied automatically.

Weighted Average Measure Life

Portfolio WAML computed from measure lives and participation, monitored year by year against minimum measure-life requirements.

First-Year & Lifetime Savings

Gross annual and lifetime savings by measure, program, sector, and plan period — with cost of saved energy per kWh.

Budget Shares & Spending Caps

Income-eligible budget shares, pilot and education spending caps, and the savings credits tied to them, tracked against thresholds.

Participation & Budgets

Estimated versus actual participation, budgets, and savings targets by program and year, at the level of installed measures.

Filing-Ready Reporting

Program-level evaluation documentation — verification and assessment of energy impacts for installed measures — packaged for regulators.
Electrification

Evaluation built for electrification, not just efficiency

Electrification flips the standard cost-benefit framework — added electric load turns traditional benefits into costs. EnerGaze evaluates electrification programs on their own terms, alongside your efficiency portfolio.

Fuel-Neutral Savings

Net fossil-fuel savings measured in MMBtu and converted to consistent kWh-equivalent savings for portfolio accounting.

Carbon Accounting

Avoided fossil-fuel use translated into net carbon reductions, in support of carbon-neutrality goals and reporting.

Rate-Impact Protection

Electric-only rate impact testing confirms that electrification offerings will not raise rates for customers who don't participate.
Demand Flexibility & DERs

M&V for demand response, DER aggregations, and virtual power plants

As portfolios evolve from efficiency programs to dispatchable, market-facing grid resources, evaluation has to keep up. EnerGaze can be configured as the independent measurement and verification layer for demand flexibility programs — from event dispatch through settlement and payment.

Event-Based Performance

Quantifies load reduction, load shifting, and DER dispatch attributable to dispatched grid events — measured as flexible capacity (kWh/MWh) delivered.

Settlement-Grade Baselines

Energy performance baselines suitable for settlement-quality meter data, built on industry-standard methodologies including NMEC, control groups, and other market-approved approaches.

Multi-System Data Integration

Ingests and reconciles revenue-quality meter data, AMI, device-level telemetry, DER management system dispatch signals, and aggregator or OEM platform outputs — at full 8760 hourly and sub-hourly resolution.

Performance-Based Payment Validation

Independent validation of performance-based bill credits, pay-for-performance partner payments, and annual true-up calculations under value-sharing programs and tariffs.

Market-Ready Verification

Verification that supports wholesale market participation and revenue tracking, avoided energy and capacity procurement costs, and program return-on-investment analysis.

New Evaluation Methodologies

Development, testing, and refinement of new performance evaluation methodologies for regulatory and market approval as programs scale and tariffs evolve.

M&V Plans & Documentation

Measurement plans covering methodologies, data sources, assumptions, sampling, and data-quality procedures — from draft plan through final governing document.

Anomaly & Gap Treatment

Explicit, documented handling of exclusions, data gaps, weather normalization, and operational constraints behind every verified result.

Secure, Auditable Workflows

Secure data exchange, version control, and responsible handling of personally identifiable information — suitable for regulatory, financial, and market-facing use.

Independent by design: transparent, auditable reporting at the participant, portfolio, and program level — with documented methodologies, assumptions, and calculation logic that stand up to regulators, funders, and market operators.

NMEC

Two NMEC engines: the open standard, plus our ML advantage

EnerGaze supports normalized metered energy consumption (NMEC) two ways — the industry-standard open-source engine regulators already know, and a proprietary machine-learning engine built for the conditions where standard models fall short.

Open-Source NMEC — OpenEEmeter / OpenDSM

Full support for the open-source OpenEEmeter (eemeter) engine and its successor OpenDSM — the standard methods for calculating normalized metered energy consumption and avoided energy use. Transparent, widely recognized, and ideal where regulatory familiarity matters most.

Proprietary ML-Driven NMEC

EcoMetricx's machine-learning NMEC engine models the nonlinear response of load to temperature — including the steep, accelerating impacts on peak event days when it is very hot. The result is counterfactual predictions that stay accurate exactly when the stakes are highest.

Why nonlinearity matters on the hottest days

A linear temperature model tracks mild weather well, but under-predicts load as heat becomes extreme — understating the counterfactual on exactly the days that decide event performance.

Peak event days(extreme heat)Outdoor temperature →Load (kWh)under-predictedloadObserved loadML NMEC (nonlinear)Standard NMEC (linear)

Better counterfactuals on the days that matter: the ML engine captures nonlinear temperature response and extreme-heat impacts, so verified savings on peak event days reflect what load would truly have been.

Outputs

Every analysis produces standardized, shareable artifacts

Summary Tables

Model results summaries and comparison tables in CSV.

Interactive Dashboards

Interactive HTML dashboards for exploring results.
{}

Diagnostics JSON

Diagnostic metadata in JSON with unified records and metrics.

Full Analyses

Complete, documented analyses ready to share with evaluators, stakeholders, and regulators.

EM&V on demand, evaluation that never stops

Developed by the EcoMetricx Data Science Team and available by subscription — bring standardized, defensible EM&V to your portfolio, the moment you need it and continuously thereafter.

Explore More Solutions