
Translating raw utility records to analysis-ready customer data
A walkthrough of EcoMetricx's general cleaning, reconciliation, and cohort readiness — turning billing, AMI, and metadata feeds into clean, defensible output.
The primary challenge is disagreement across sources
Monthly billing, interval, and customer data describe the same service differently. Our process scales to any dataset size, addressing instances when even rare data issues occur.
01
Time
02
Customer + Meter Matching
03
Usage Quality
Proven at scale: millions of customers with monthly billing + AMI processed through this cleaning system.
A six-stage cleaning system turns raw feeds into defensible outputs
Each stage has explicit checks, decisions, and evidence — from raw feeds to analysis-ready history.
1 · Ingest
Prove completeness
2 · Standardize
Align schema + time
3 · Detect + Repair
Find gaps + outliers
4 · Reconcile
Identify and resolve source differences
5 · Classify
Assign context + cohort
6 · Validate
Release with evidence
Validation questions at the final gate: Did every source file land? Can every repair be explained? Are cohorts mutually exclusive? Can the release be reproduced?
A toolkit for flagging unusual customers
Pairing statistical and ML detectors with AMI usage and customer-attribute extracts to detect anomalous usage.
01 · Statistical
Univariate flags on account fields
02 · ML-Based
Multivariate customer-profile outliers
03 · Time Series
Anomalies within one meter's history
04 · Load-Shape
Group customers by usage pattern
05 · Applied Checks
Solar usage validation
EV Detection
AMI spikes and ML models strengthen EV detection
Retroactive updates make reconciliation continuous
Utilities can revise prior data months later, requiring versioned archives and repeatable reconciliation. We preserve every version of every extract and flag changes that exceed a threshold set to your preference.
- Prior snapshot: archived utility batch, version N
- Reconcile N ↔ N+1: same account · meter · interval
- Decision: accept · replace · review · retain
- Archive + threshold: preserve every version, flag changes ≥ X SD from prior usage
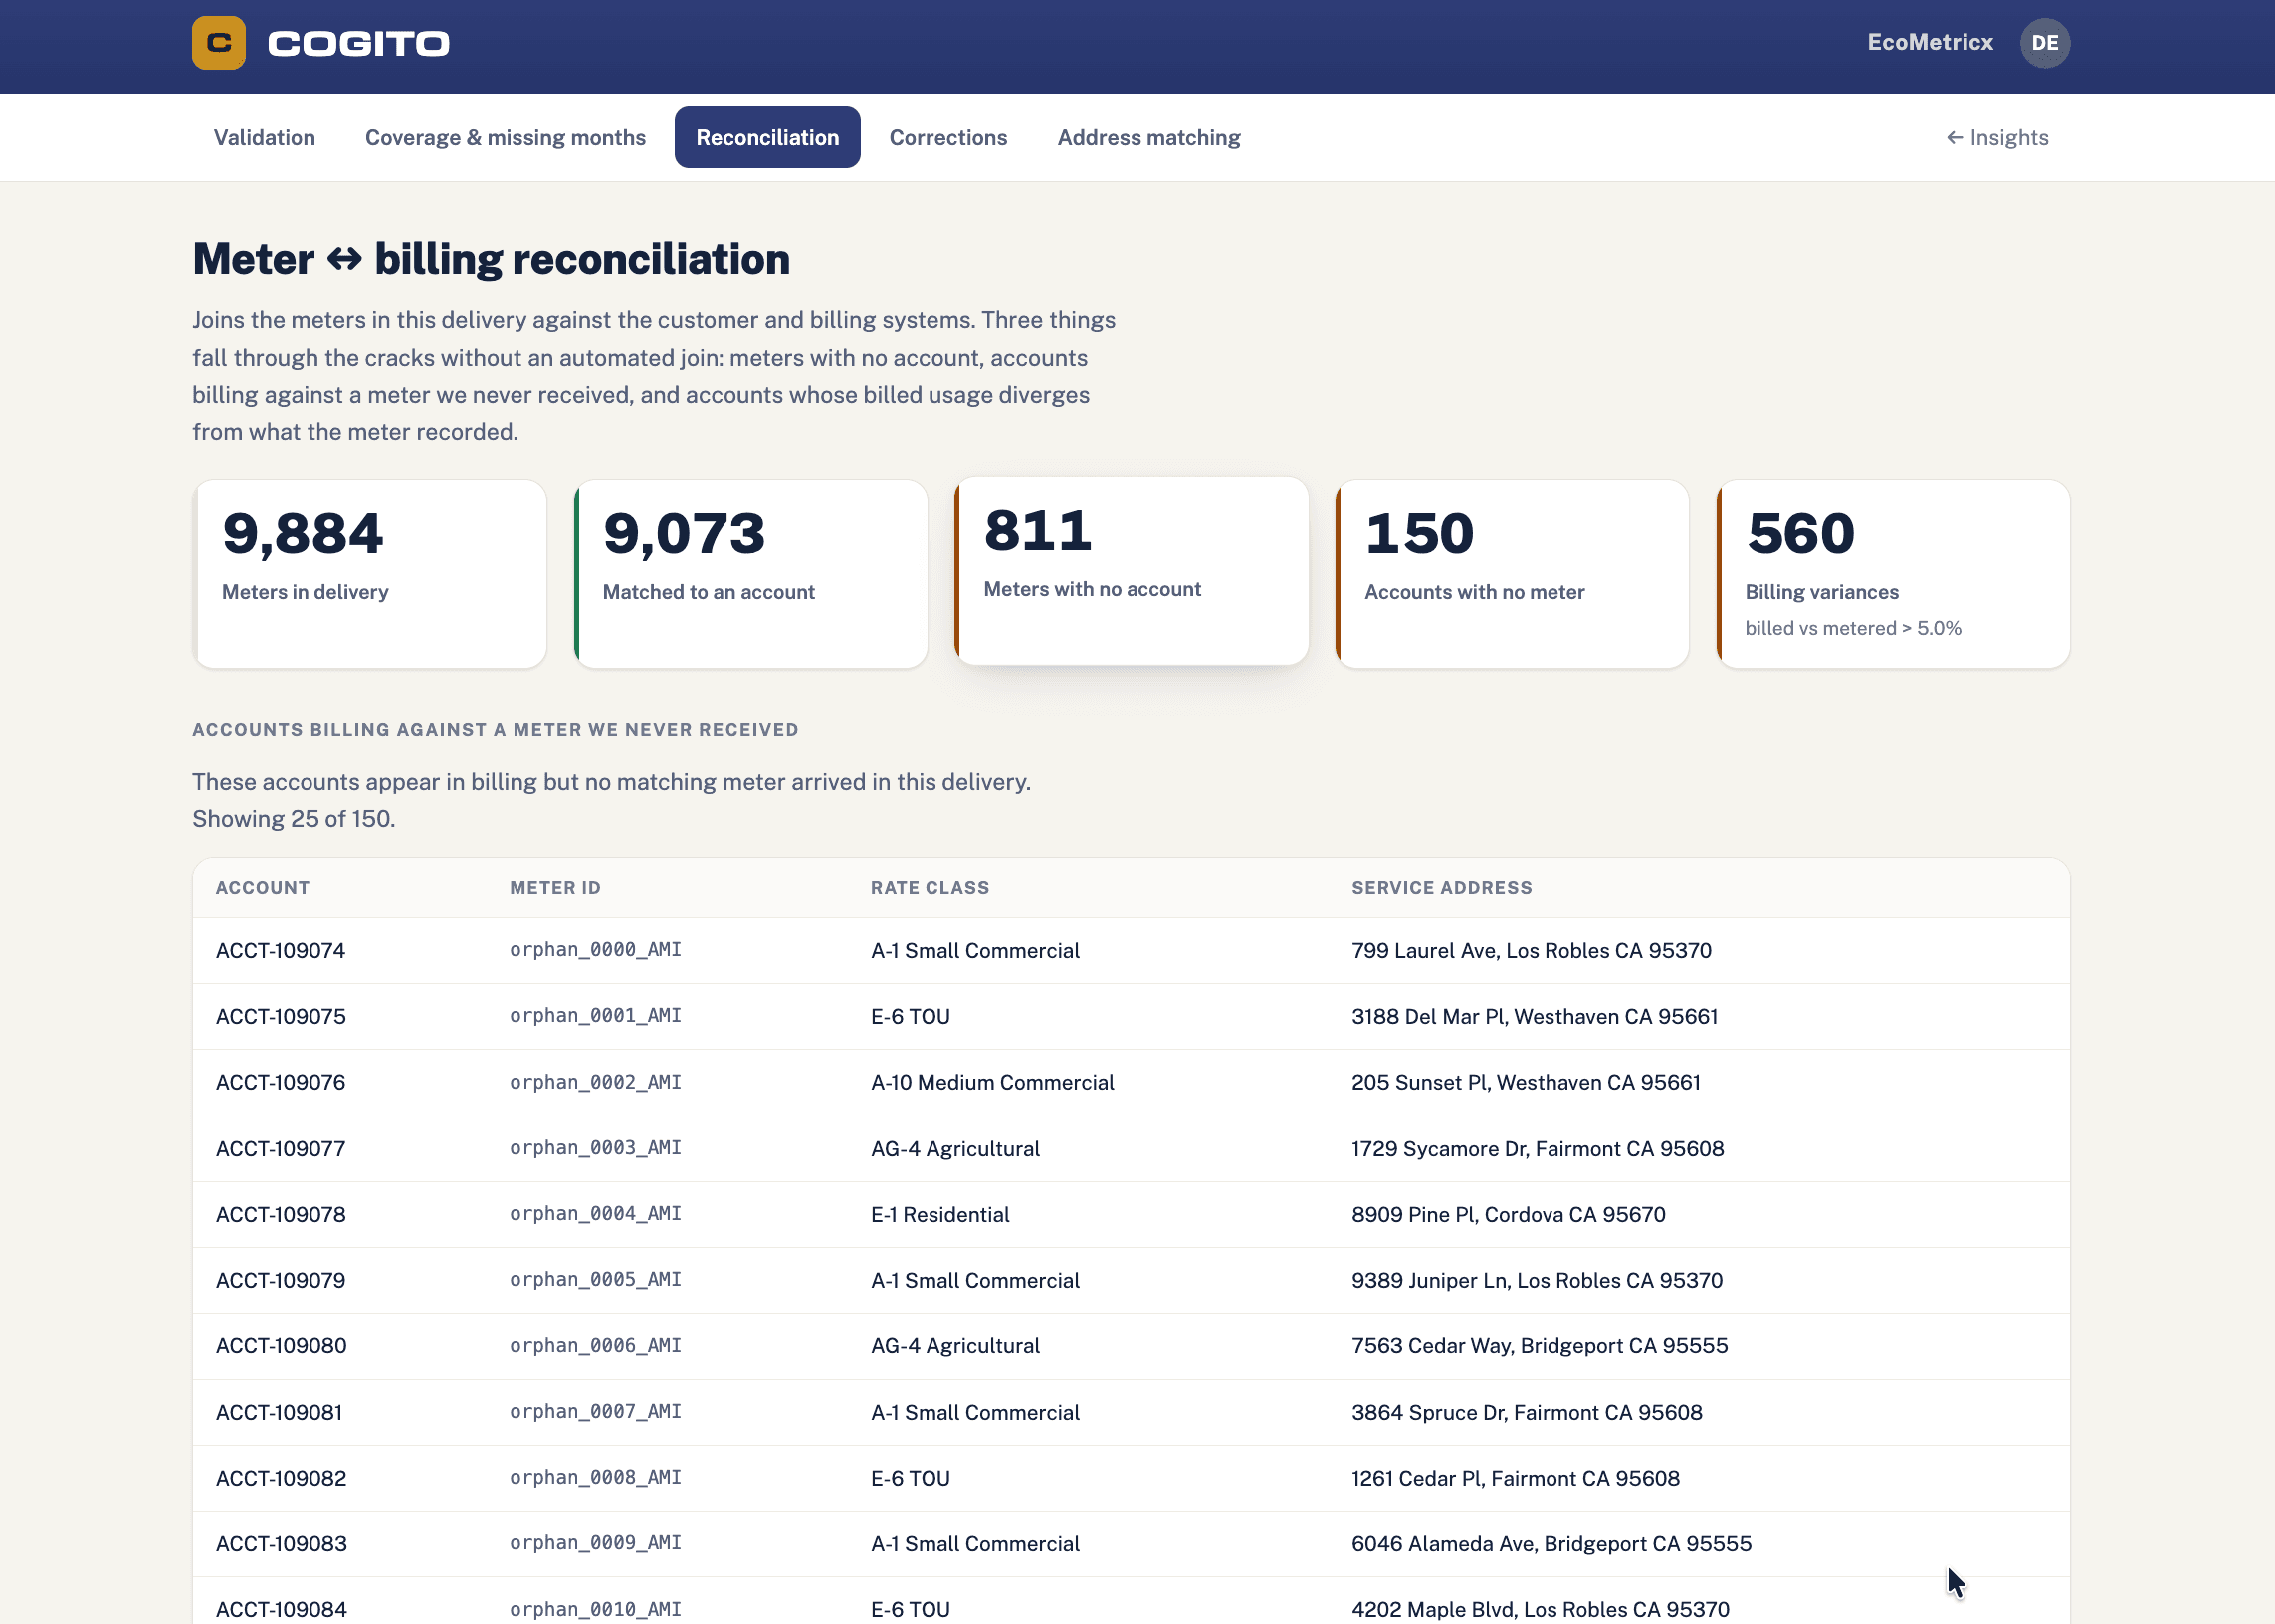
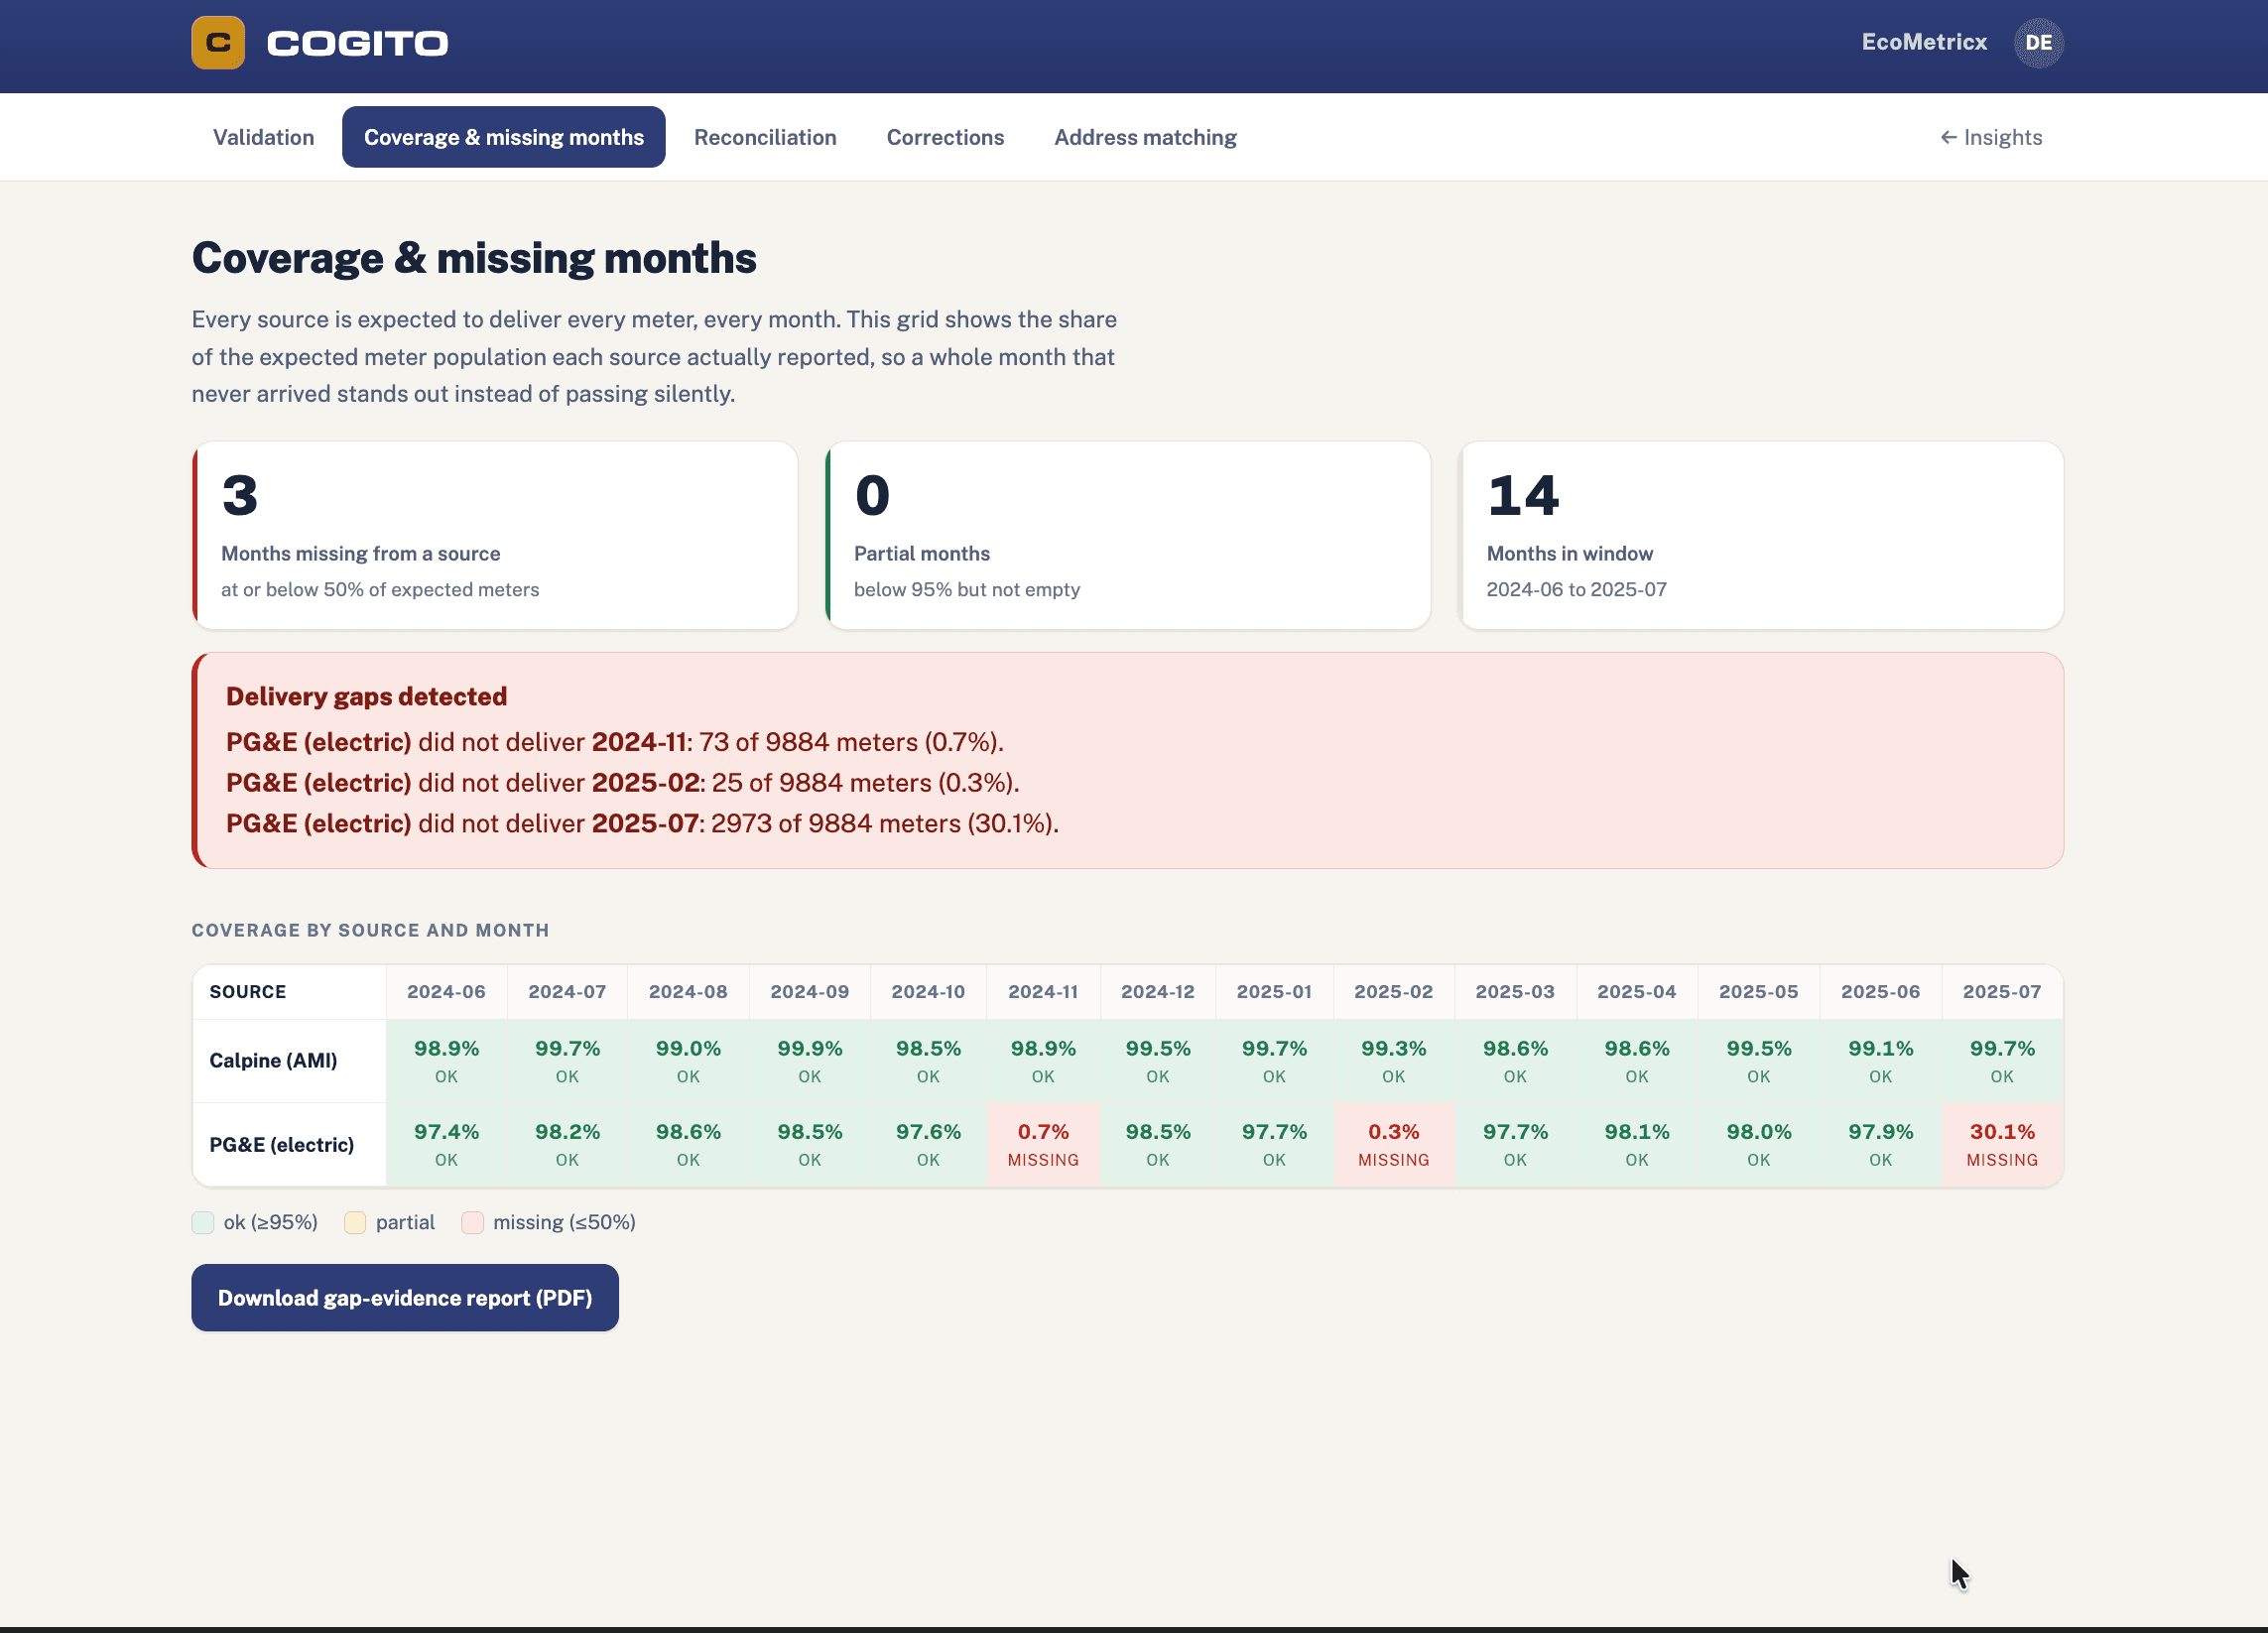
Results surfaced in a validation user interface
Every result is documented and visible, so coverage gaps, corrections, reconciliation results, and address matching are never a black box.
- Validation summary with dated PDF exports
- Coverage view with a source-by-month grid that makes a missing month visible at a glance
- Reconciliation view showing matched meters, meters without accounts, accounts without meters, and billing variances
- Corrections view that opens and quantifies every correction file, including how late it arrived and how much usage it restated
- Address matching reduced to a small, scored review queue of exact matches, fuzzy matches, and uncertain pairs
We ingest utility feeds, reconcile identity, time, usage, and context — then document and validate every decision
01 · Ingest
02 · Time
03 · Usage
04 · Context
05 · Governance
Result
Start with clean, defensible data
Clean, reconciled, versioned data is the foundation that makes analytics trustworthy. Talk to us about a data cleaning and validation engagement for your feeds.